Kingdom of Thailand
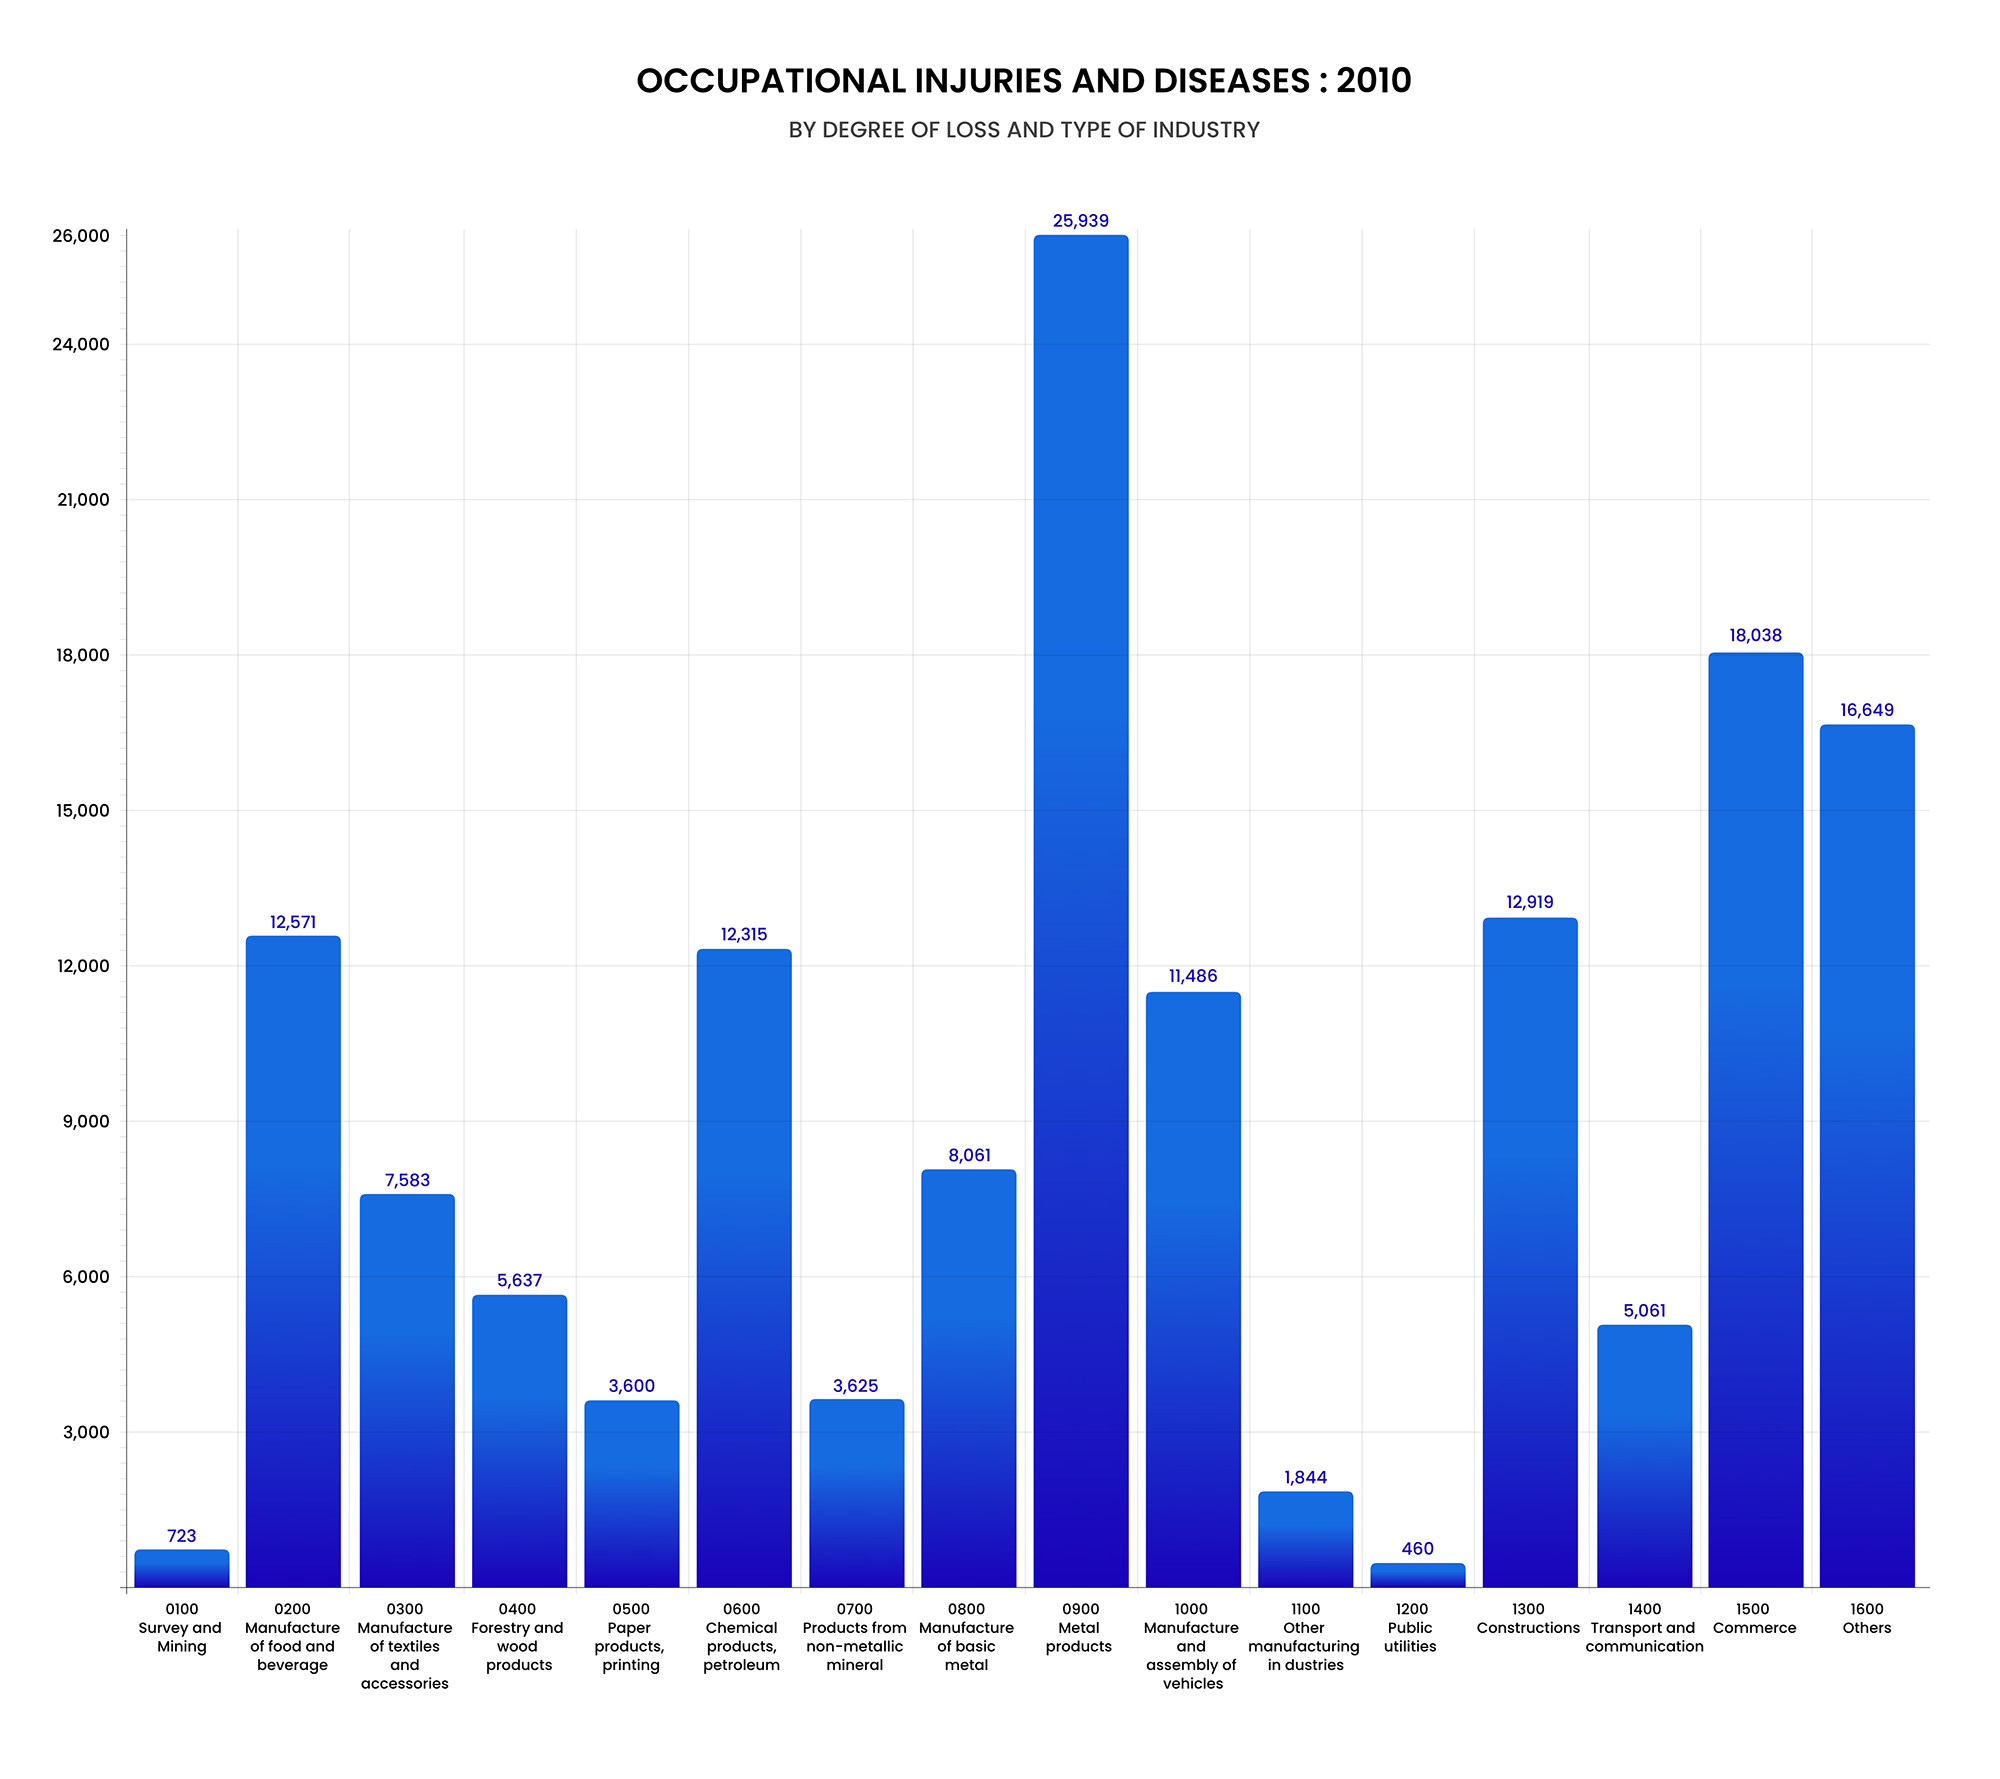
OCCUPATIONAL INJURIES AND DISEASES 2010
by Degree of Loss and Type of Industry
| Industrial Classification | Degree of loss | Total | ||||
|---|---|---|---|---|---|---|
| Death | Permanent Total Disability | Permanent Partial Disability | Temporary Disability >3Days | Temporary Disability <3Days | ||
| 0100 Survey and Mining | 7 | - | 10 | 300 | 406 | 723 |
| 0200 Manufacture of food and beverage | 42 | - | 208 | 4,342 | 8,534 | 12,571 |
| 0300 Manufacture of textiles and accessories | 9 | 1 | 147 | 2,131 | 5,295 | 7,583 |
| 0400 Forestry and wood products | 16 | - | 187 | 2,276 | 3,158 | 5,637 |
| 0500 Paper products, printing | 10 | 2 | 76 | 1,257 | 2,255 | 3,600 |
| 0600 Chemical products, petroleum | 22 | - | 247 | 3,470 | 8,576 | 12,315 |
| 0700 Products from non-metallic mineral | 24 | - | 61 | 1,257 | 2,283 | 3,625 |
| 0800 Manufacture of basic metal | 12 | - | 166 | 2,096 | 5,787 | 8,061 |
| 0900 Metal products | 35 | - | 507 | 6,199 | 19,198 | 25,939 |
| 1000 Manufacture and assembly of vehicles | 16 | - | 184 | 2,469 | 8,817 | 11,486 |
| 1100 Other manufacturing in dustries | 2 | - | 24 | 358 | 1,460 | 1,844 |
| 1200 Public utilities | 17 | - | 2 | 183 | 258 | 460 |
| 1300 Constructions | 79 | 1 | 106 | 2,824 | 9,909 | 12,919 |
| 1400 Transport and communication | 137 | 1 | 50 | 1,699 | 3,174 | 5,061 |
| 1500 Commerce | 107 | 3 | 150 | 5,351 | 12,427 | 18,038 |
| 1600 Others | 84 | 3 | 65 | 4,221 | 12,276 | 16,649 |
| Total | 619 | 11 | 2,190 | 40,433 | 103,813 | 146,51 |